As snow begins to fall and cold temperatures make it less appealing for people to get out on the river, the Task Force gets the time to look back and analyze a successful 2023 summer’s worth of Gallatin River Water Quality Monitoring data. As we’ve seen, the factors that affect the Gallatin’s water quality change with the seasons much like the migration of animals or patterns of seasonal weather.
Gallatin River Water Quality Monitoring
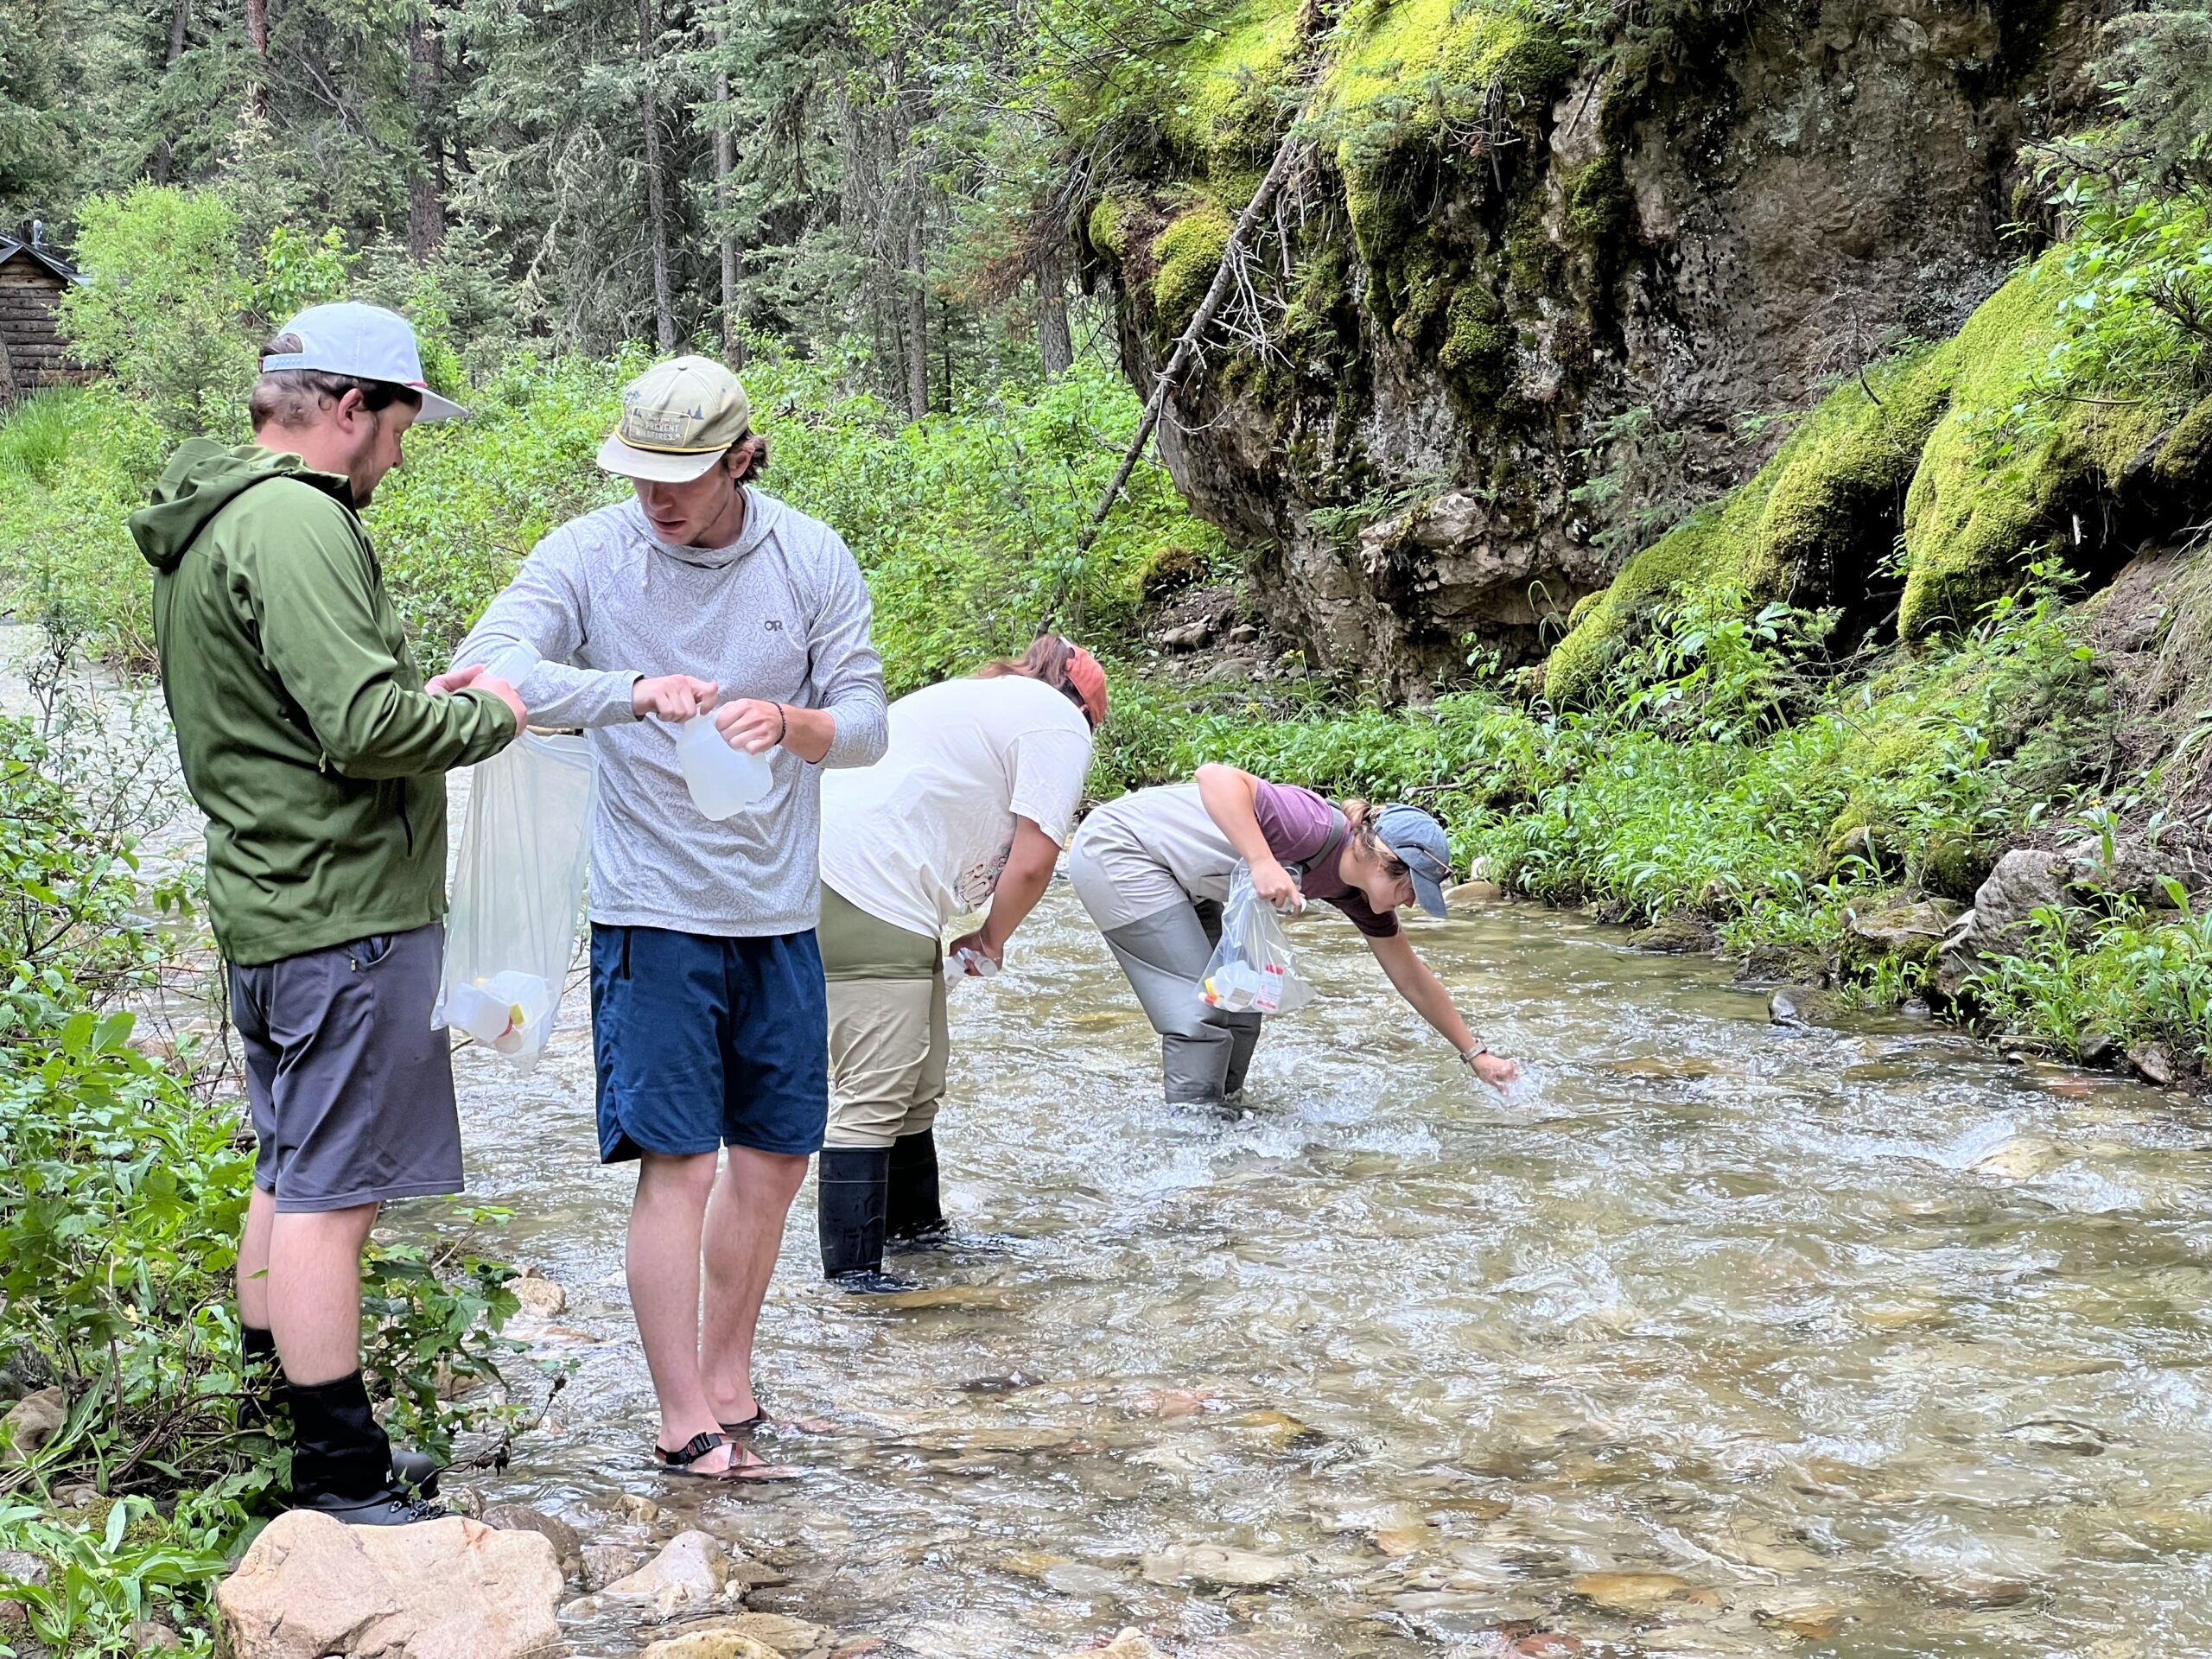
Our 2023 sampling season began in early March. Single digit temperatures and ice picks were eventually traded for waders and then Chacos as we progressed into the warmer months.
Groundwater
The primary motivator for collecting water samples during winter months is to gather insight on groundwater characteristics. At this time, groundwater seeping up into the river is the primary source of streamflow, when the rest of the landscape is covered in ice and snow. Data collected in March 2023 saw higher than average levels of nitrogen in the West Fork when compared to historical data, but we saw lower than average levels in the mainstem of the Gallatin. Lower than average streamflow last winter played a role in this, but so did the groundwater characteristics of the aquifers within the West Fork drainage.
Runoff
And as the spring temperatures begin to rise and the snow starts to melt, the chemical makeup of the river begins to change as well. This change is most obvious during runoff when water levels rise and the river turns to a color reminiscent of chocolate milk.
This year we saw the Gallatin reach peak streamflow on May 23rd, when the USGS Gallatin Gateway gauge read 4820 cfs. A far cry from 2022’s major flooding event that saw levels in the Gallatin peak at greater than 8000 cfs. Streamflow naturally fell off in June and July but a wet August helped the Gallatin have an above average streamflow this year, something everyone can get behind.
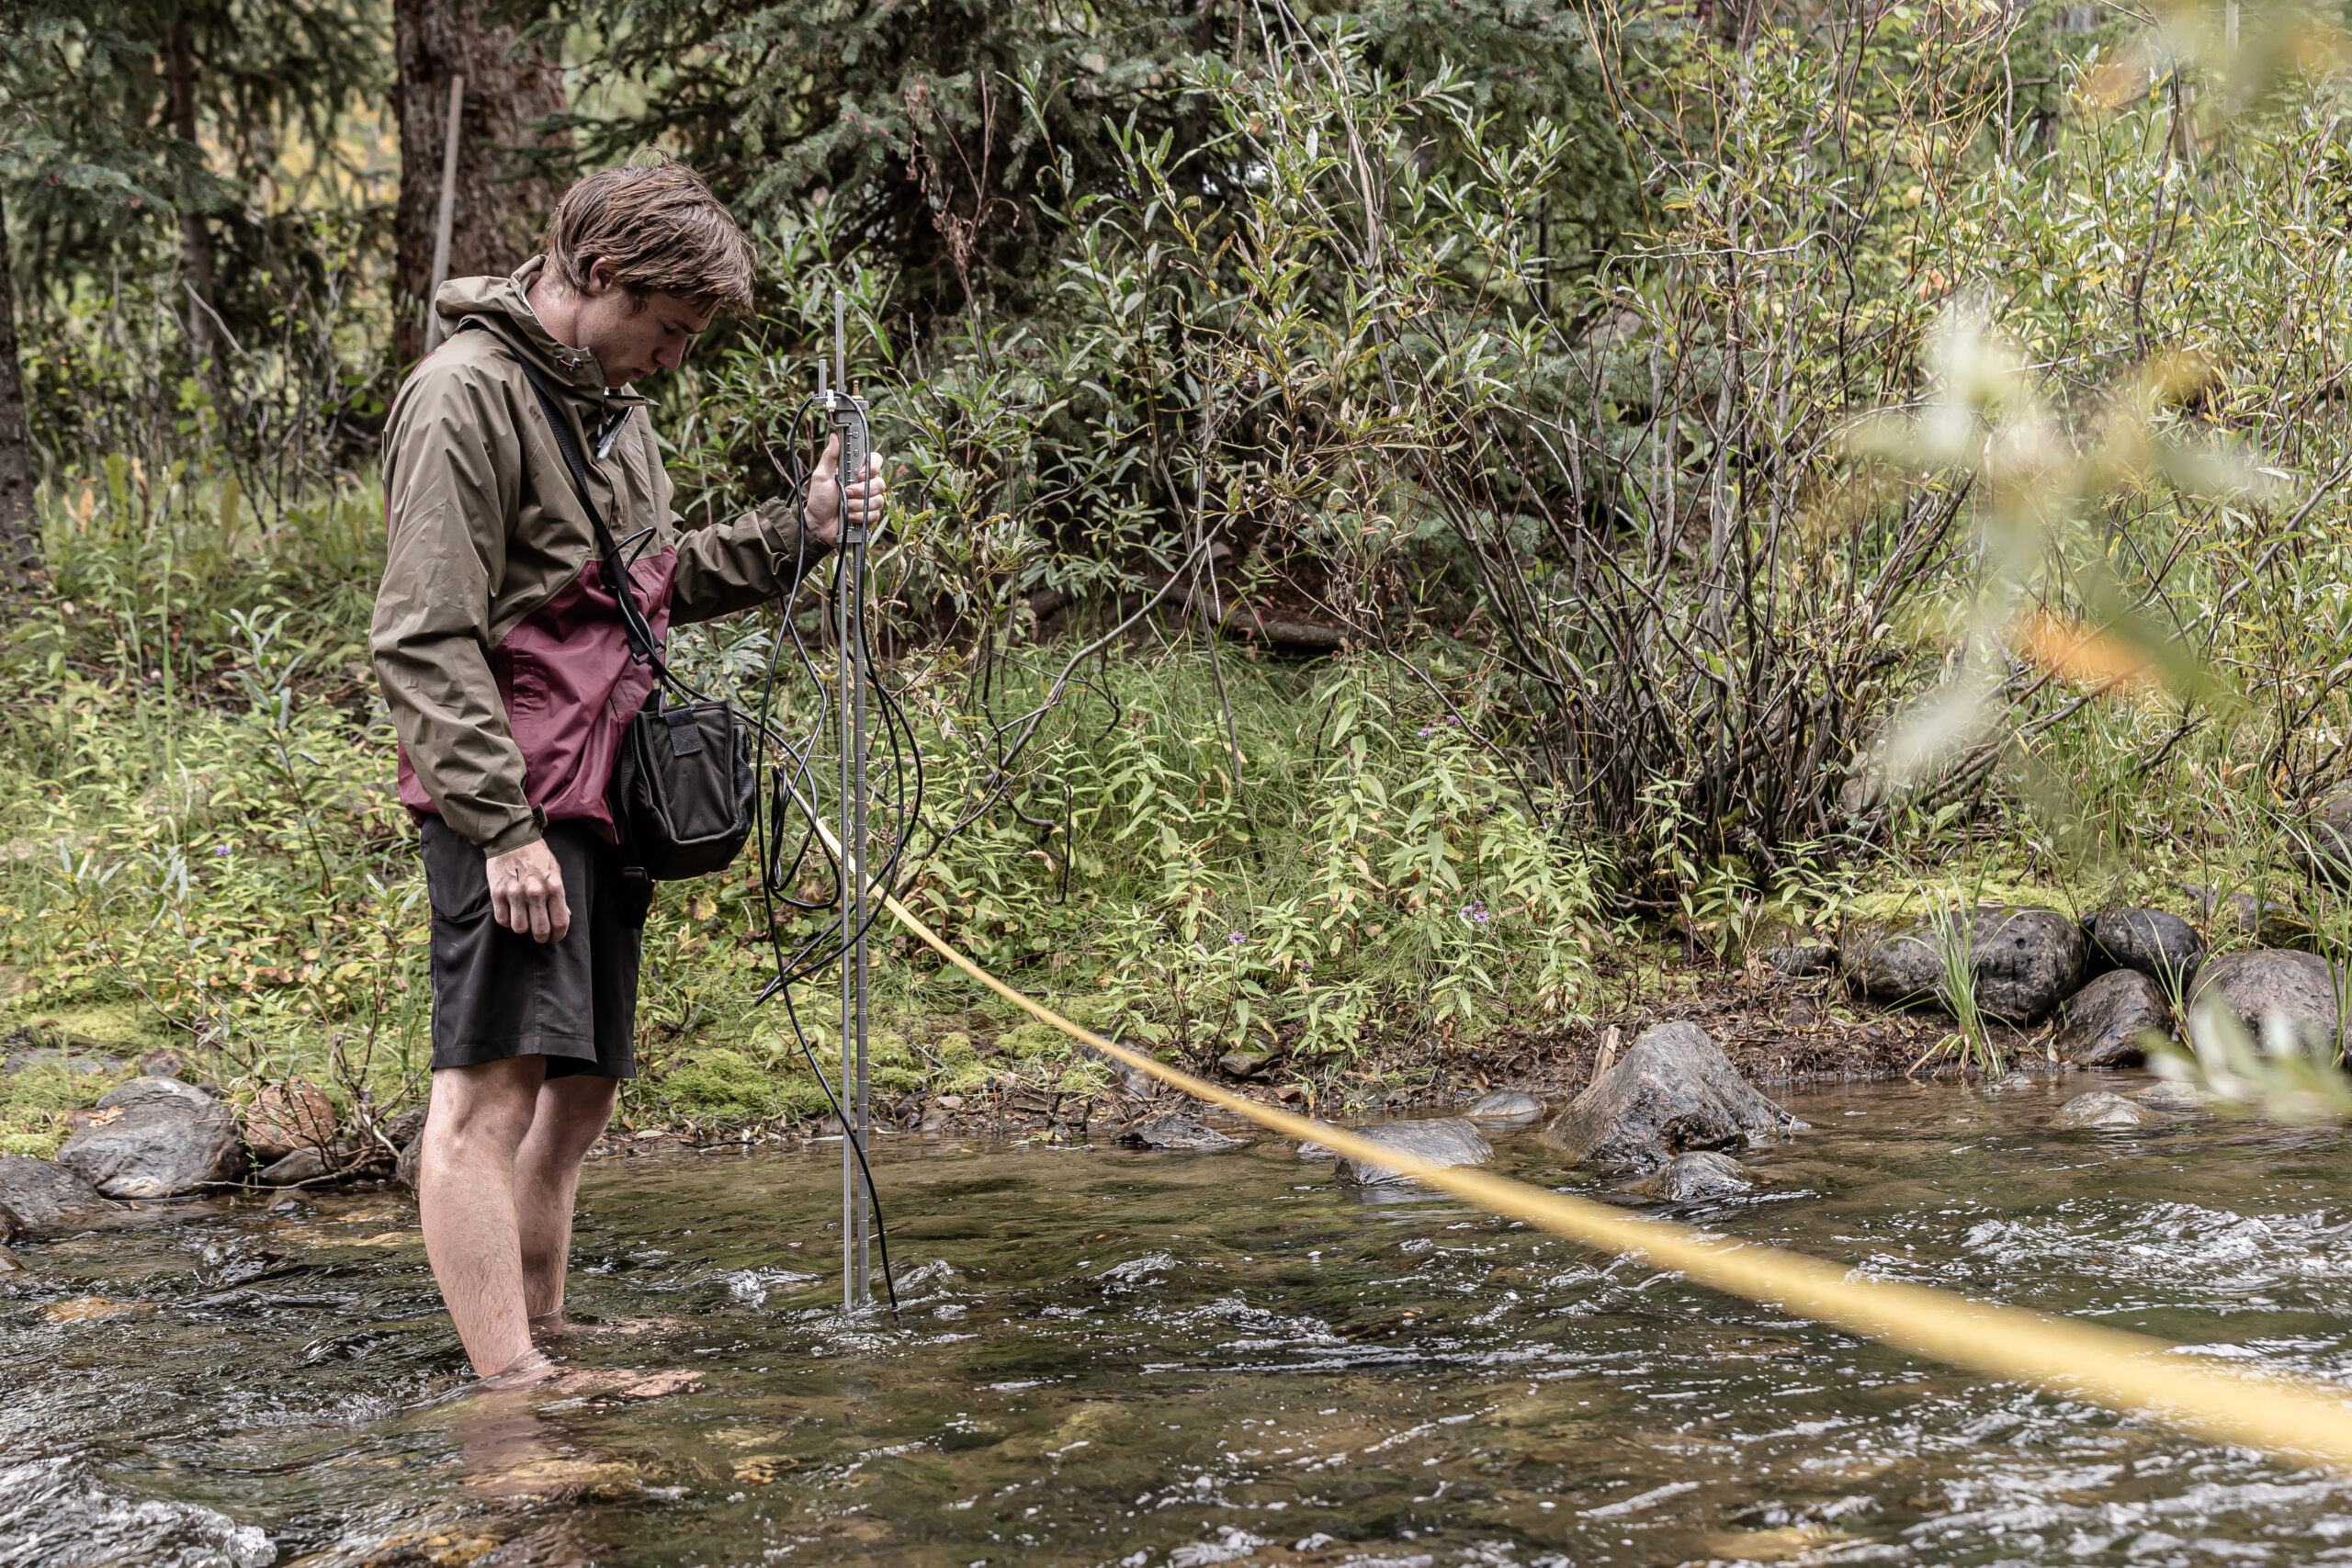
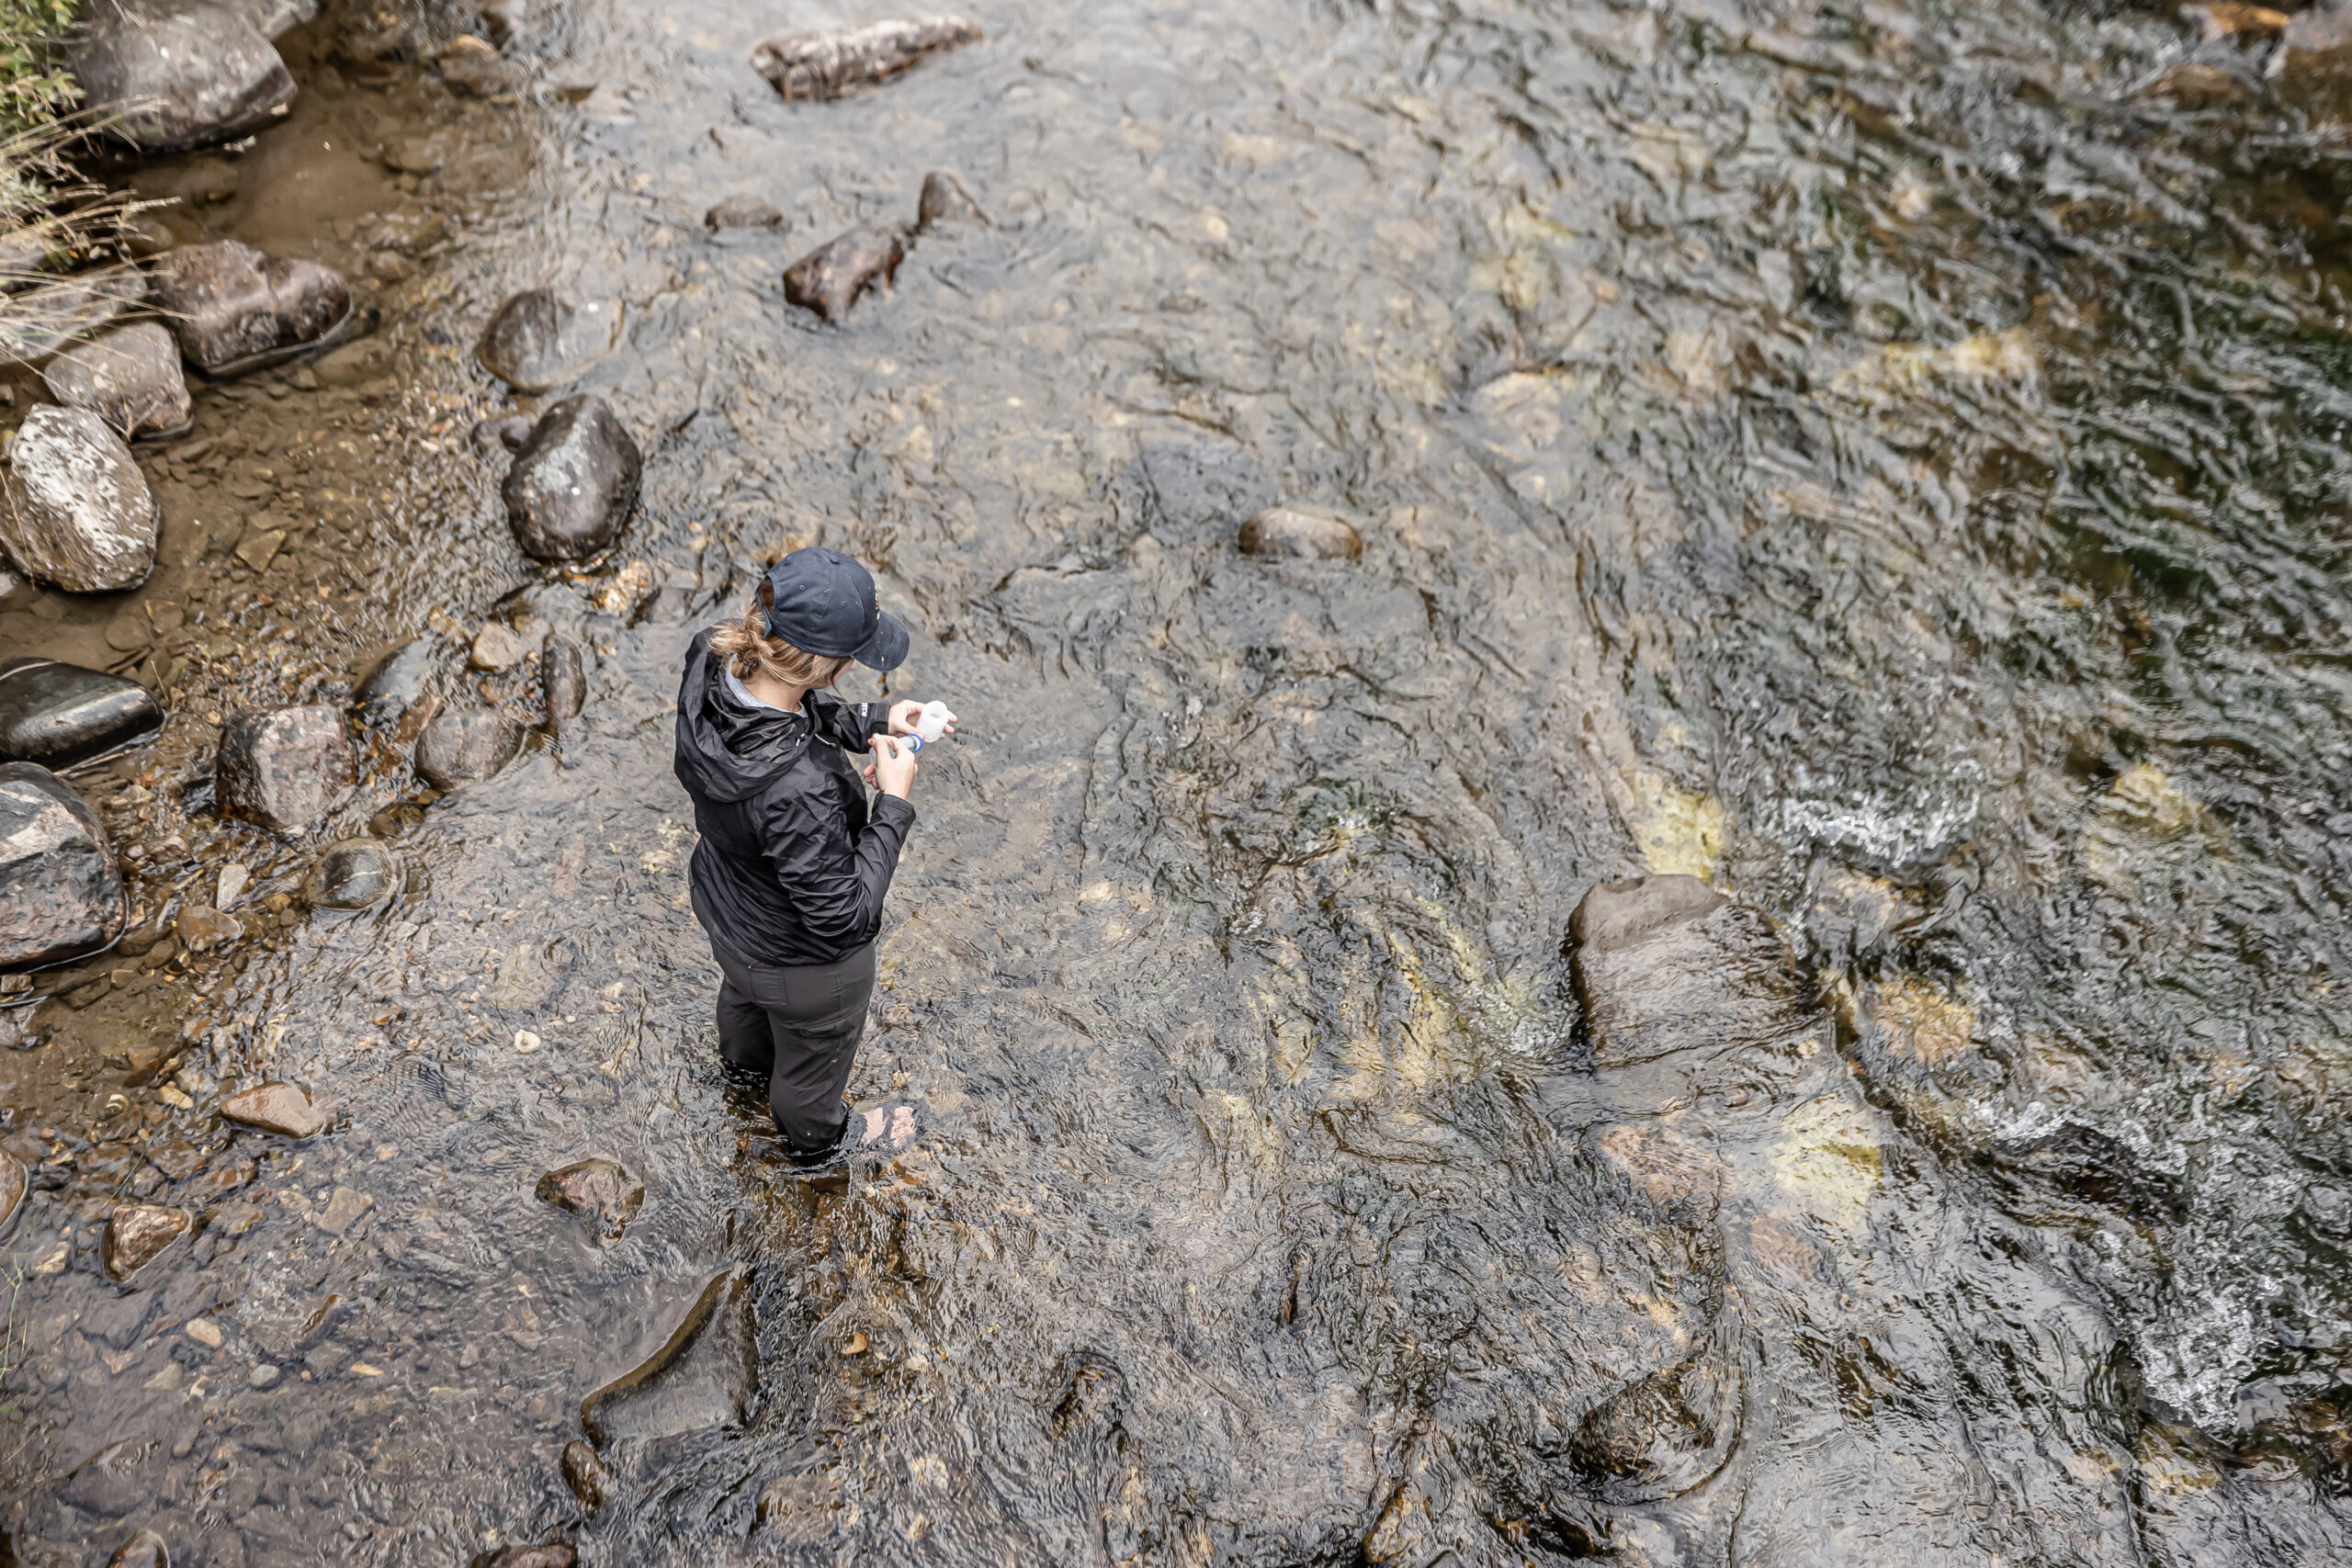
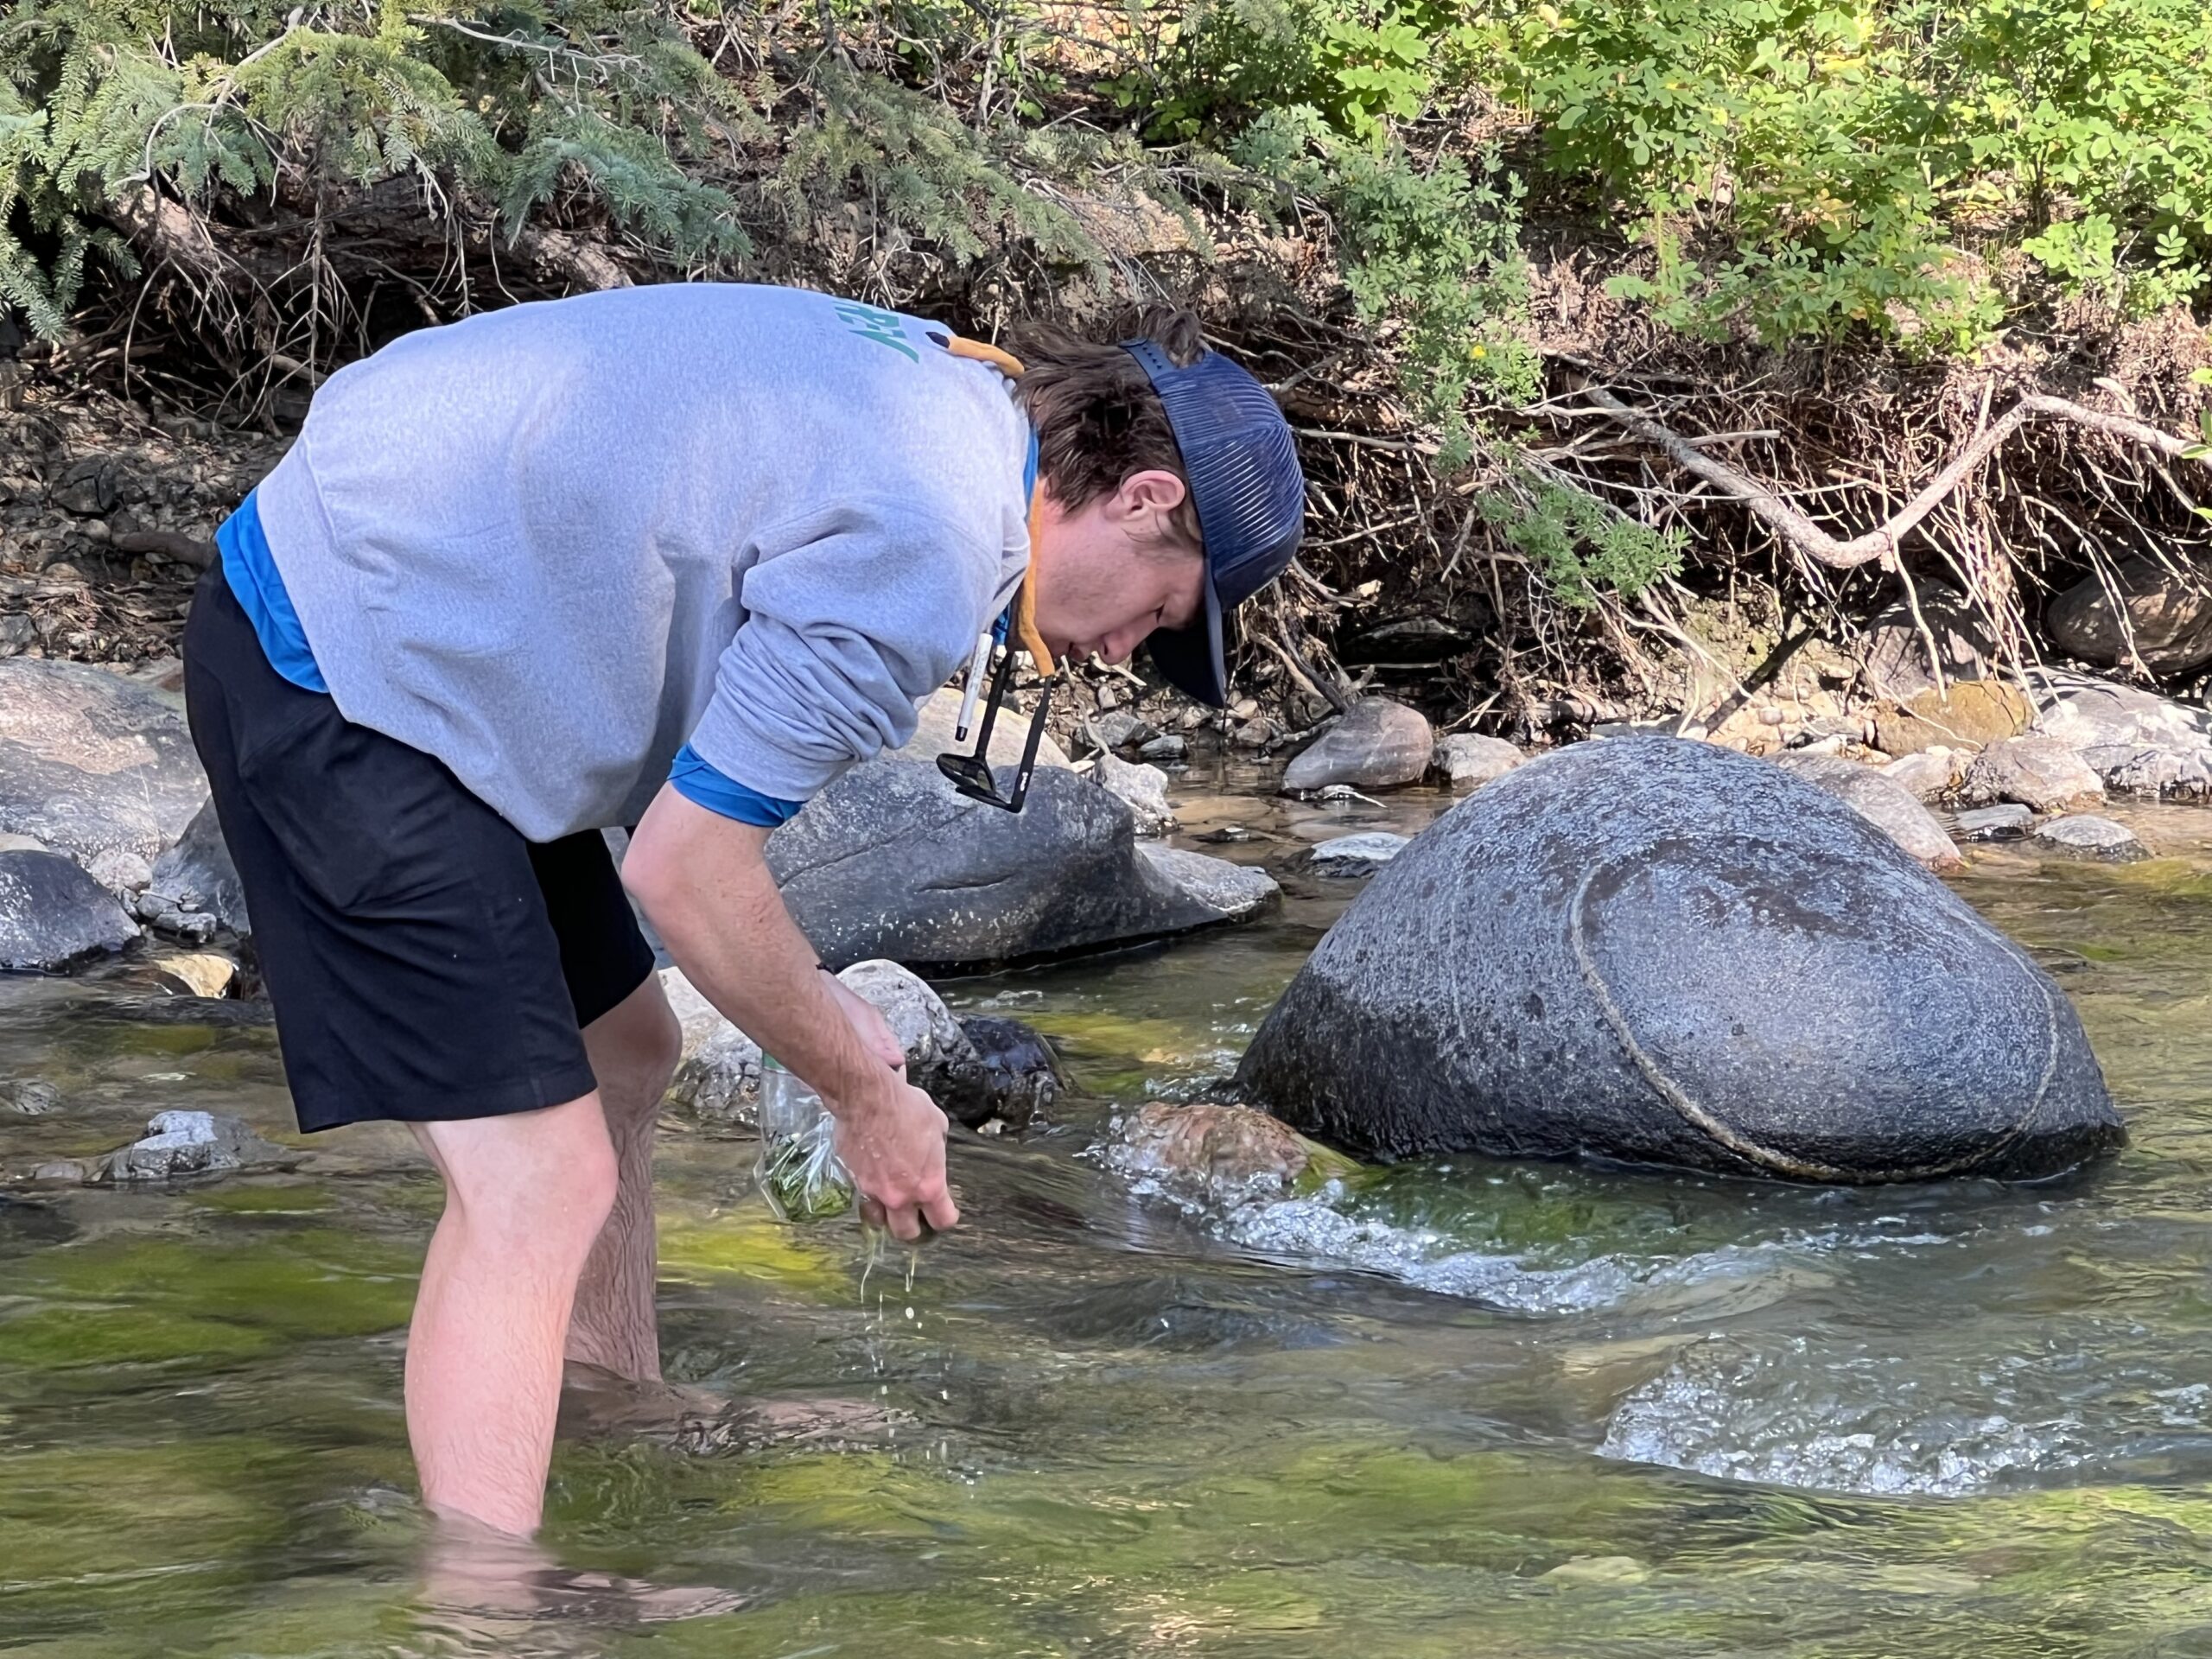
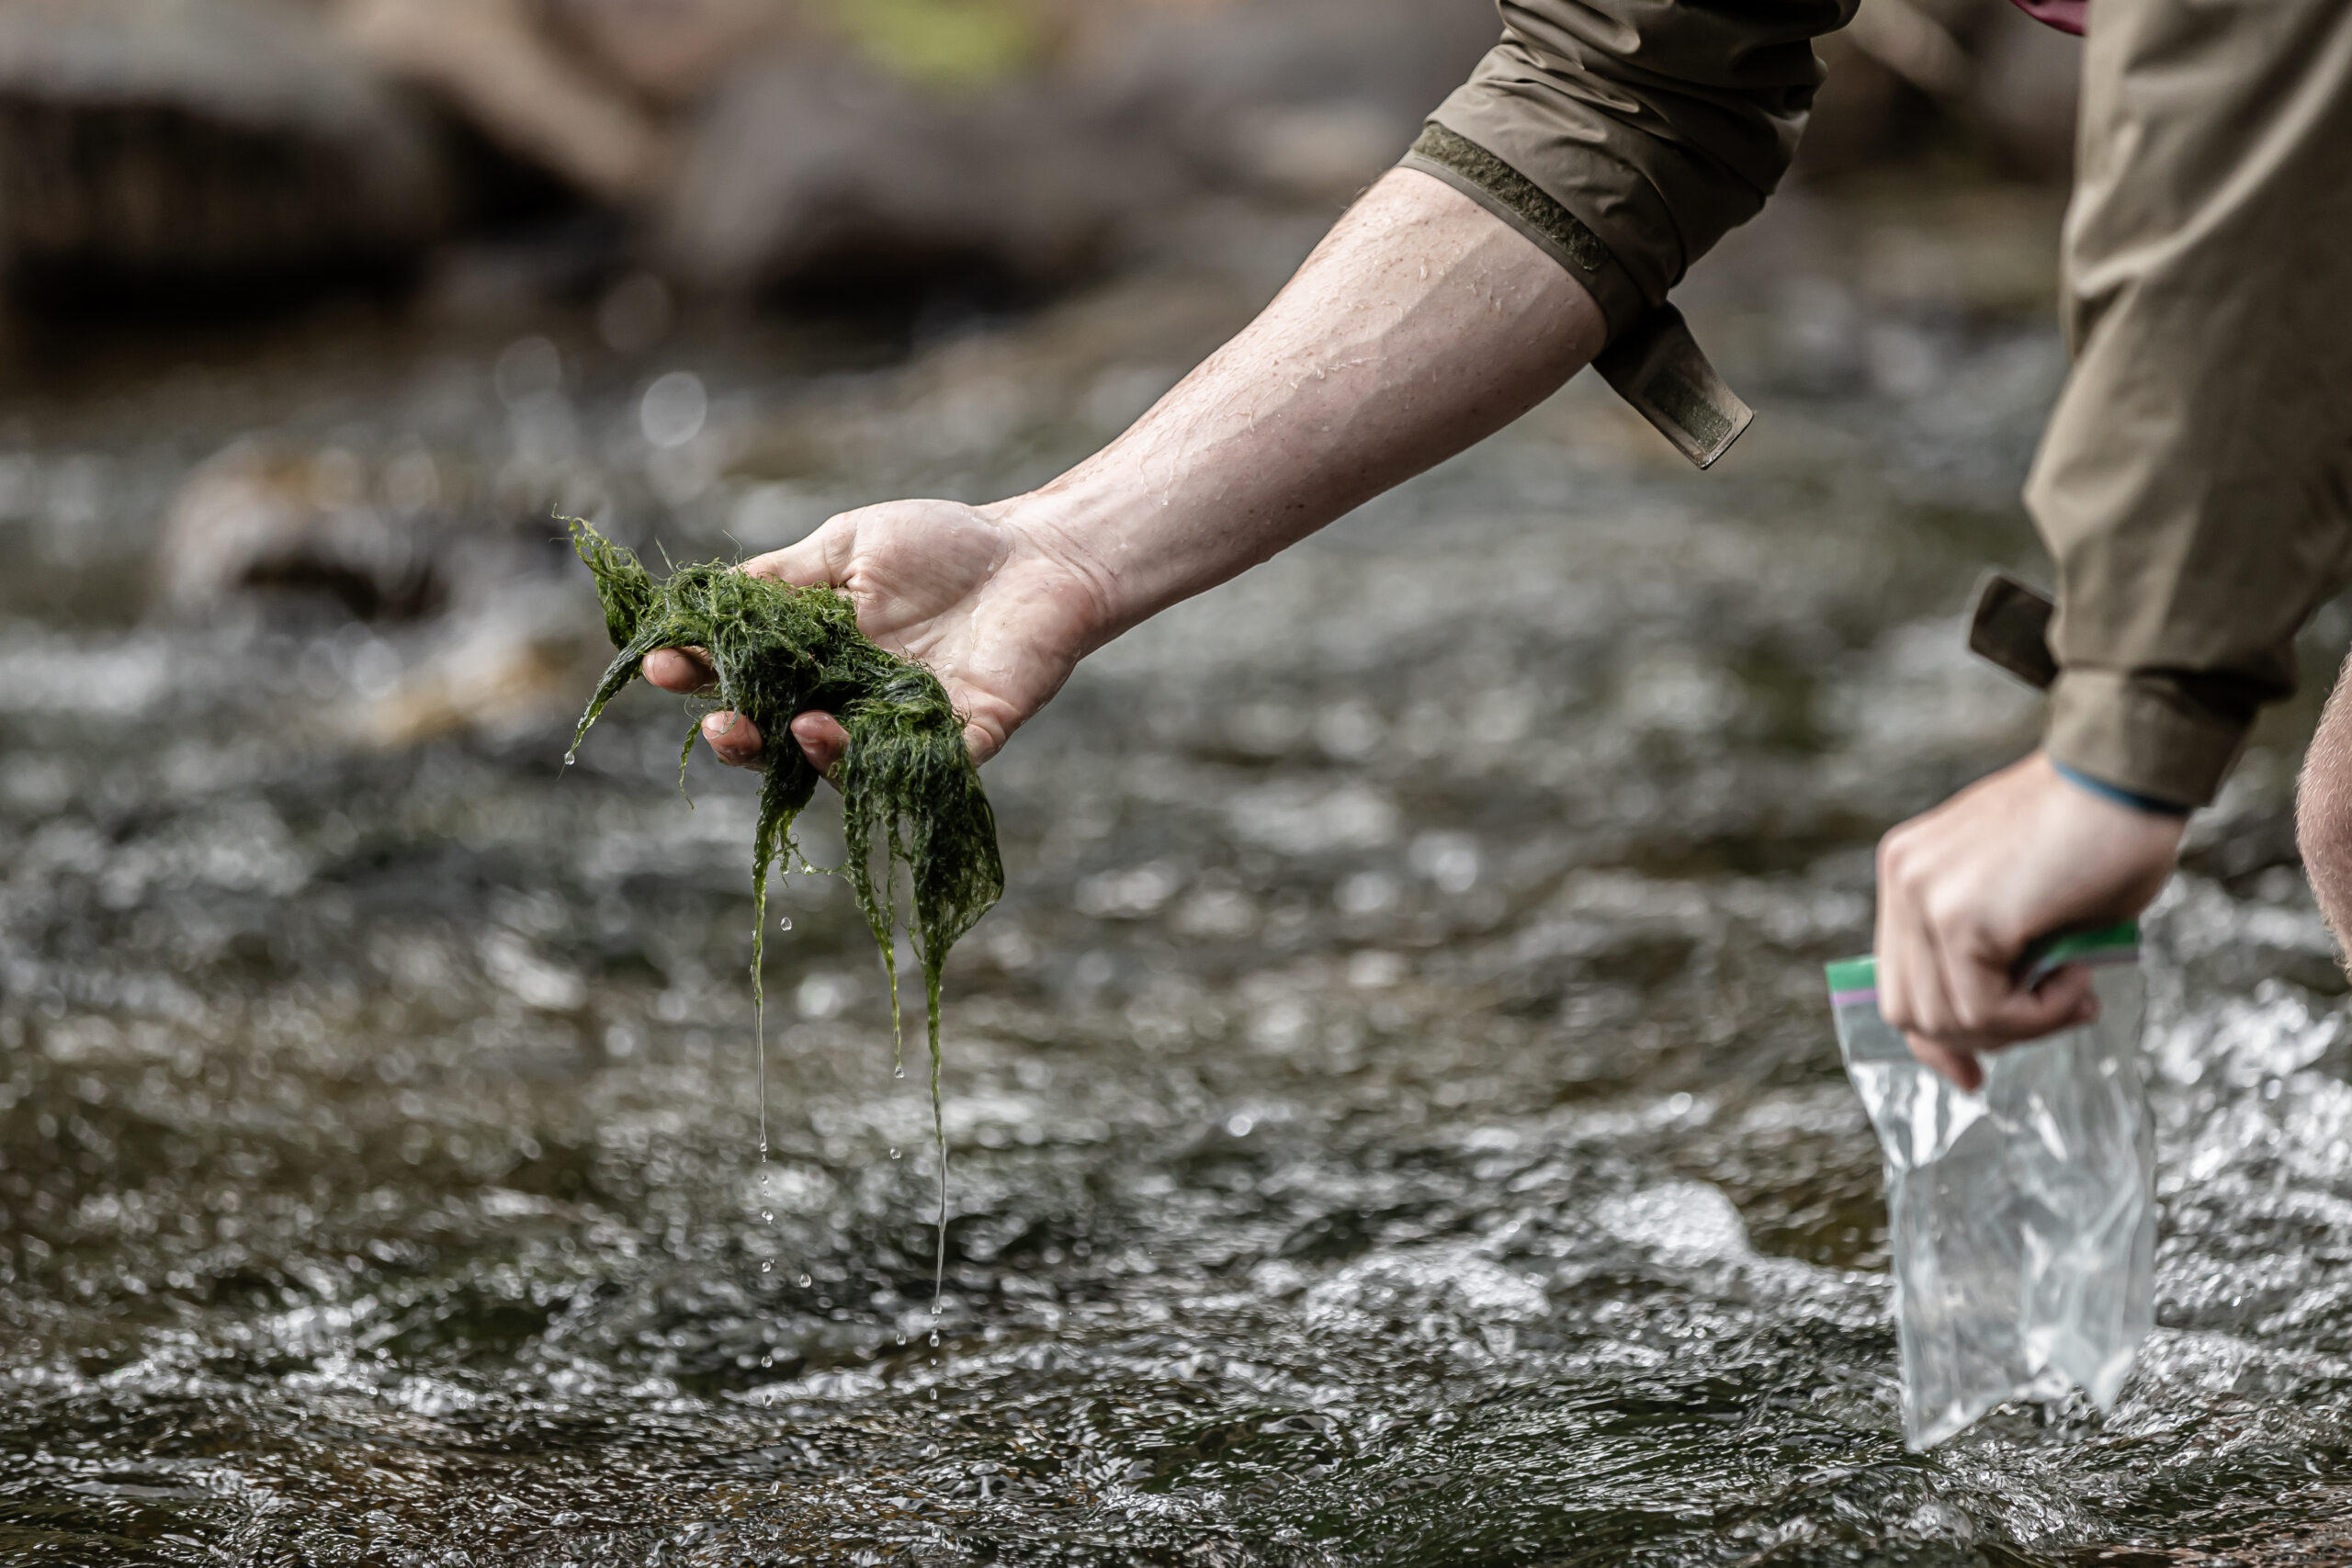
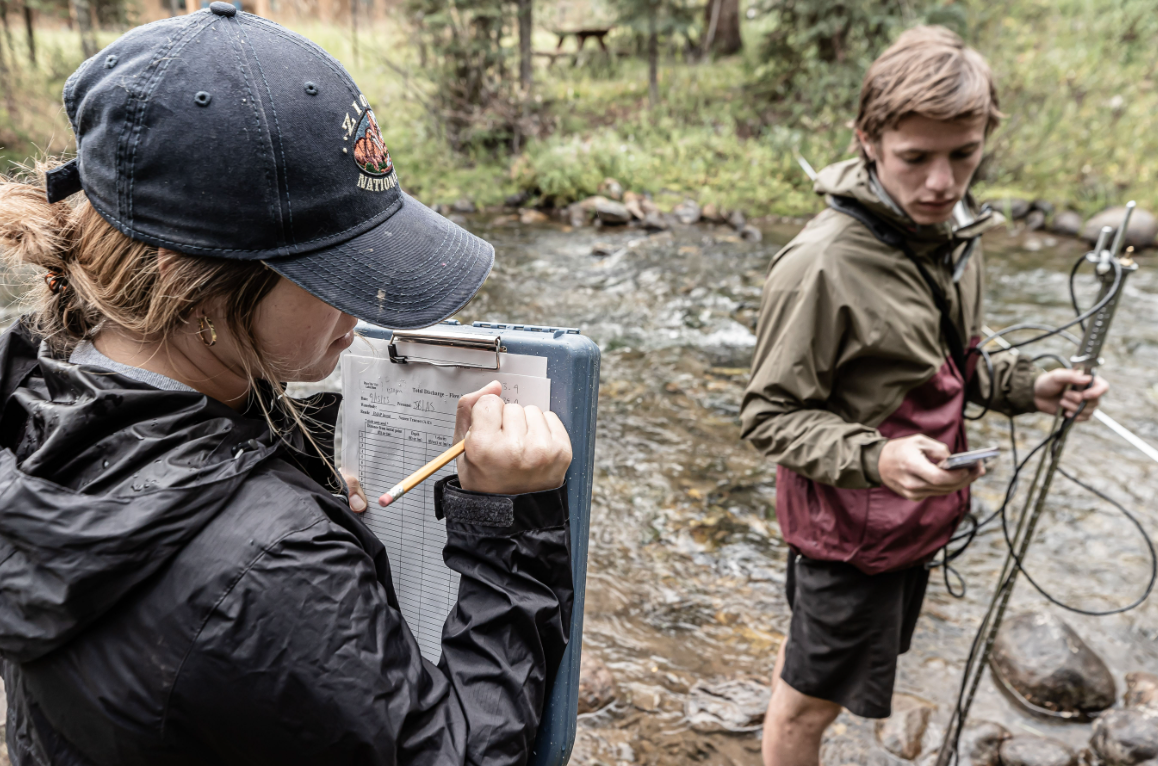
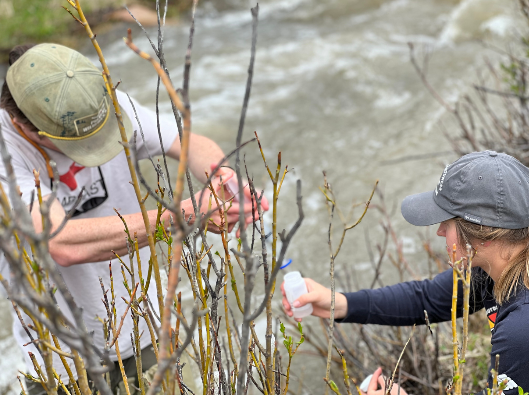
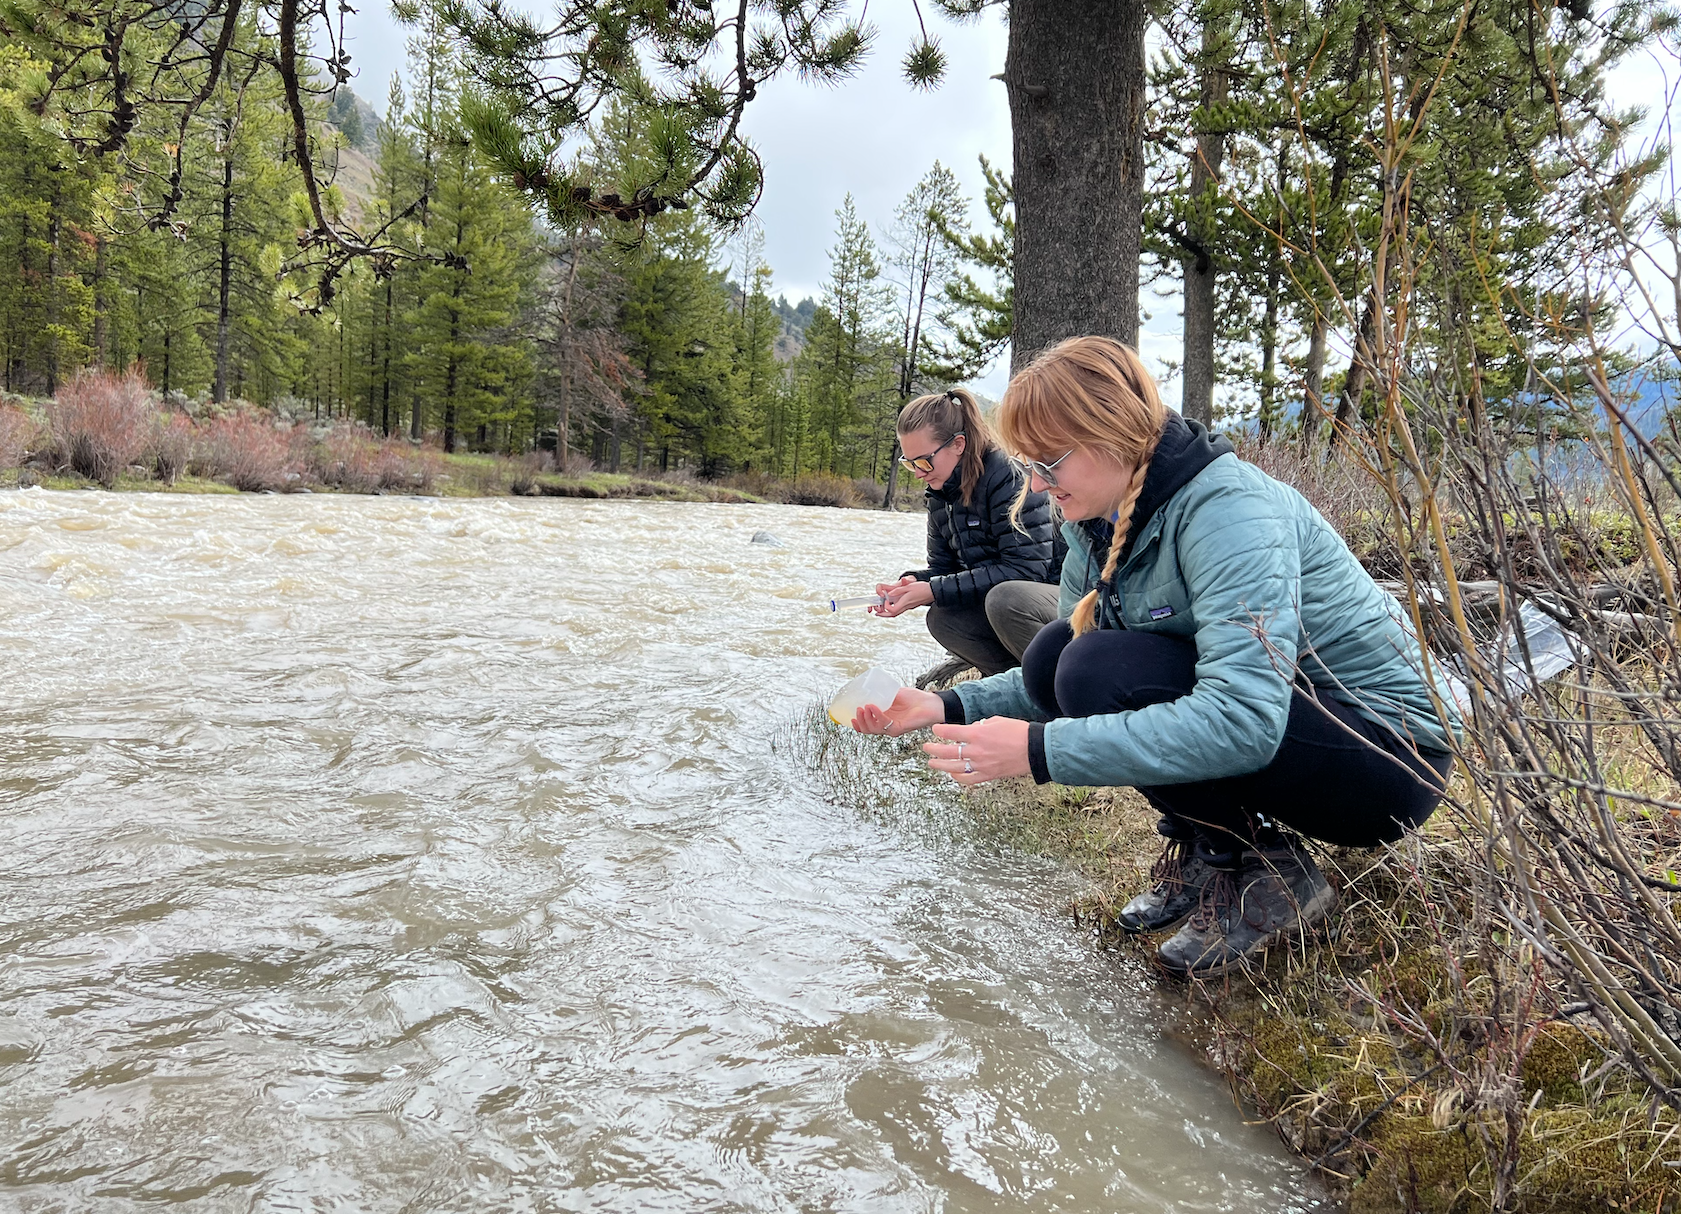
Runoff also coincides with when we begin our summer sampling season. The Task Force sampled monthly from May to October for water chemistry and also sampled for algae in August and September.
Water Quality Changes
While it can be easy to see how the quantity of water in the river fluctuates throughout the season, it can be much harder to see how water quality changes as the summer progresses. We saw concentrations of nitrogen and phosphorus peak in August and September, probably due in part to lower streamflow being unable to dilute these nutrients as effectively. We also saw large-scale nuisance algae blooms appear on the West Fork, South Fork, and Taylor Fork as well as Portal and Beaver Creeks, but did not observe a large-scale nuisance algae bloom on the mainstem Gallatin like we did in 2018, 2020, and 2022.
Water Quality Monitoring Data
Data suggests that algae growth is caused by multiple factors including elevated nutrient levels, warm water, low streamflow, hard water, and high levels of sunlight. The high levels of rain and cooler temperatures we received this summer played a role in the fact that we did not observe a large-scale bloom on the mainstem Gallatin River. While this is good news, our work will continue to focus on leading conservation and inspiring stewardship of the Gallatin River watershed. Ongoing restoration projects along the Middle Fork and mainstem Gallatin will help maintain late season flow by slowing down water moving through the landscape and will also decrease effects of erosion along streambanks.
Water Quality Programming
Programs such as our water-wise rebate program encourage reduces residential water use throughout the community by offering upgrades to outdated water fixtures. The monitoring that we complete every year helps us get a better look at everything that is affecting the river that we cannot see with the naked eye, and helps steer our decision making process in how to better manage the health of the Gallatin; because ultimately, it is up to us to make sure the Gallatin runs clean and cold for future generations.
Support
our mission.
Get your
hands dirty.
Join us for
our events.
Stay Connected
Read More
Gallatin River Task Force Member Spotlight: Joanna McCoy
This month's Gallatin River Task Force Member Spotlight: Joanna McCoy gained her deep affection for the outdoors from her father, and from growing up on a dairy farm on the Little Sandy River in Kentucky. Opportunities through college courses and experiences along the...
Thank You to Our Upper Deer Creek Restoration Project Volunteers!
This Earth Day, the Gallatin River Task Force is celebrating the incredible success of the Upper Deer Creek restoration project, and a huge part of that success goes to our amazing volunteers! Healthy Rivers, Healthy Planet Clean water is essential for life on earth,...
Envision Gallatin FLUM Comment Guide
Gallatin County is entering the second phase of Envision Gallatin with the objective of creating a Future Land Use Map (FLUM) and Housing Strategy (HS). The FLUM will help inform future zoning regulations, guide development for the county, and ultimately help protect...
Water Wise Landscapes in Big Sky Montana
Water Wise Landscapes in Big Sky - Is your Landscape Water-Wise? Did you know that landscape irrigation use spikes by a whopping 160% during summer months? That's a lot of water, and a significant portion is lost to evaporation, especially when watering during the...
