
Comment to Predict the 2017 Peak Streamflow at Gallatin Gateway
Warm and dry weather in March liquidated low elevation snow and drove locals off the mountain and to the river. Yet, winter’s revenge persuaded powder hounds to return to the slopes a mere month later.
The winter of 2017 was a fickle friend. Snow water equivalent (the amount of water contained in the snow pack) persisted below average for most of the 2017 water year.
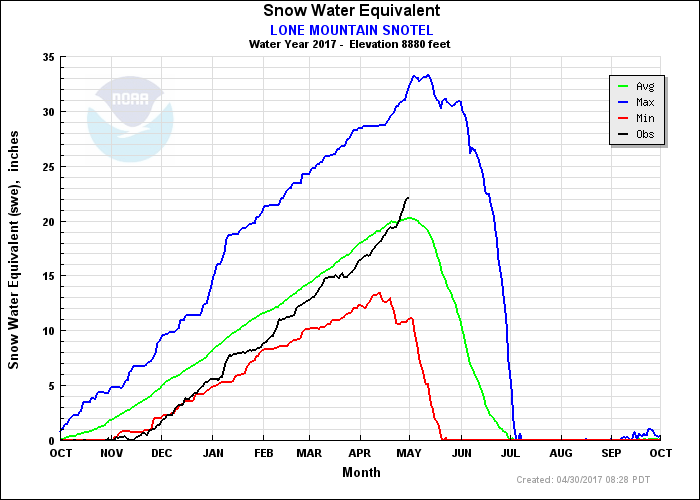
Snow water equivalent (SWE) for the water year to date (October 1, 2016 to September 30, 2017) from NOAA. Observed conditions (black line) graphed with minimum (red line), average (green line), and maximum (blue line) conditions from 1989 to 2012. SWE in the Upper Gallatin increased slowly in the early season, thanks to a warm, wet fall and bone-chilling, dry January. February offered knee-deep powder; however, unseasonably warm conditions in March melted low elevation snow in a few short weeks. During April, winter returned with a vengeance, bolstering the SWE to above average conditions for the first time in 2017.
Early Spring?
Snow disappeared from the Meadow Village in mid-March, eliminating cross country skiing on the Big Sky Golf Course.
Spring had arrived, or so we thought….
The Task Force team began to worry about the impacts warm, dry spring weather and early runoff would have on the Gallatin River. In the arid West, snowpack is our future water. Melting snow sustains Montana watersheds, like the Upper Gallatin, throughout the hot, dry summer.
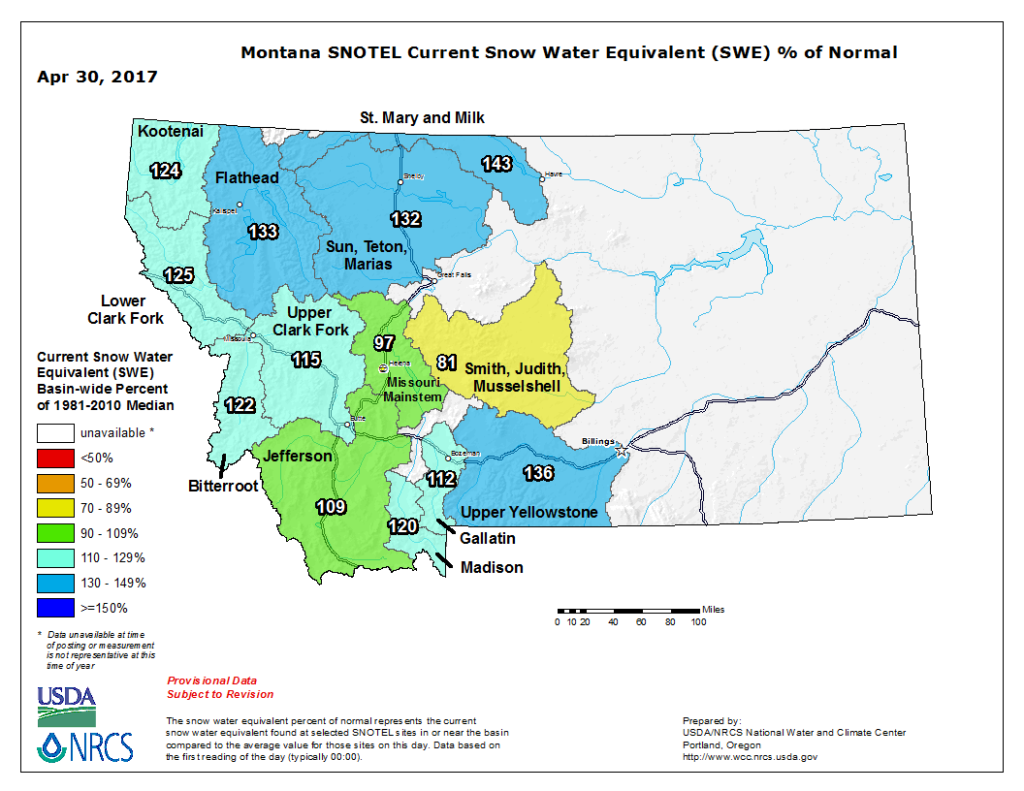
Current snow water equivalent (SWE) compared to the 1981 to 2010 normal from Montana NRCS. Currently, SWE in the Gallatin Basin is just above average conditions (112%).
Winter’s Revenge
In the past month, winter has returned with a vengeance. April snowstorms have boosted snowpack at the Lone Mountain SNOTEL (SNOw TELemetry) above average conditions for the first time this winter.
This is good news for the Gallatin River and the skiers, anglers, boaters, and irrigators who depend on cold, clean, and abundant water!
In March, we predicted an early runoff, and below average peak flows, but now we’re not sure what to expect. Below are low (25% of average), median, and high (75% of average) peak streamflows for Gallatin at the USGS station near Gallatin Gateway.
| Gallatin River Historic Streamflow (1931 to 2016) | |
|---|---|
| Percent of Average | Streamflow (CFS) |
| 25% Average | 4070 |
| Average | 5030 |
| 75% Average | 6450 |
Share Your Predictions
What do you think peak flow in the Gallatin will be in 2017? When will the Gallatin peak? We’ll announce the best guess on our Facebook page.
Photos by Stephanie Lynn and Mike Richter