
Background
On Thursday, the Task Force joined a team led by Montana Fish Wildlife and Parks (FWP) to survey fish population on the South Fork of the West Fork (South Fork). We sampled directly above the confluence with Second Yellow Mule Creek (the drainage affected by the spill) and at three locations below the confluence.
These sampling locations were chosen to provide context for the area affected by the spill, in the absence of substantive historical data.
Data
Overall, the fish population appeared relatively healthy. Our team found 5 dead trout immediately downstream from the confluence with Second Yellow Mule Creek. Many sculpin showed evidence of fin erosion, related to high levels of suspended sediment carried downstream from the steep slopes exposed below the pipe failure.
A thick layer of fine sediment has been deposited in the South Fork since the spill, which has the potential to impact spawning habitat. Hopefully, a good spring runoff will flush excess fine sediment through the system.
Methods
Fish population information was collected using the depletion method, described below. Warning: don’t try this at home.
-
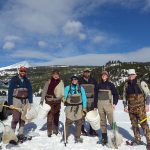
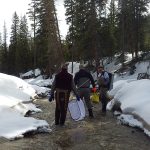
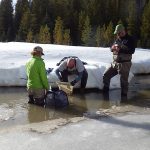
- 1) Assemble a team of experts. In the photo, smiling and skilled members of Montana Fish Wildlife & Parks, United States Forest Service, Confluence Consulting, Inc, and Gallatin River Task Force congregated at the South Fork trailhead on Yellowstone Club property.
-
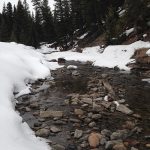
- 2) Assess the stream. Select a reach at least 75 meters long or 35 times the average wetted width of the channel, whichever is longer. This ensures that all habitat types are represented.
-
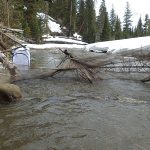
- 3) String a net downstream and build barriers to fill any gaps. This will catch any missed fish that float or swim downstream.
-

- 3) Record site characteristics, including: substrate composition, riparian vegetation, and stream channel and stream bank condition.
-
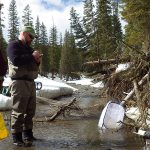
- 4) Set the frequency as low as possible to be effective and minimize potential injury to fish. Do not electroshock in water warmer than 62 F or during the spawn to minimize stress to fish.
-
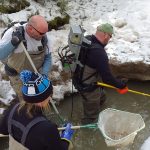
- 5) Walk the identified reach. The ‘shocker leads and netters follow closely, catching stunned fish as they float downstream.
-
- 6) Transfer captured fish immediately to a “live car” to minimize the risk of shocking twice. Do not overcrowd temporary holding pens.
-
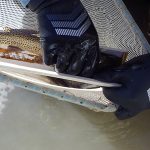
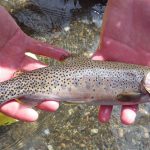
- 8) Work Westslope Cutthroat trout first. Identify to species, count, and measure all fish lengths.
-
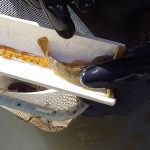
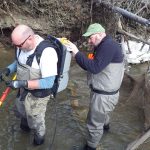
- 9) Measure all other fish species. In the photo, Dave deftly measures a trophy sculpin.
-
- 10) Record results.
-
- 11) Allow fish to reacclimate in “live car” or slow moving water.
-
- 12) Release downstream and repeat. On Thursday we used the depletion method, which is used on small streams with relatively low fish population (<2,000 individuals) during short sampling intervals. This method relies on the assumption that the number of fish captured will measurably and predictably decrease on each pass.
Interpretation
The good news is that the fish appear to be relatively resilient to the immediate changes in water quality; however, Fish Wildlife and Park will continue to analyze fish population data in the context of incoming data. The Gallatin River Task Force expects laboratory results to continue rolling in throughout the week.
After receiving these results, the Task Force will release a report with analysis and historical context. At the Gallatin River Task Force, we believe that the only way to accurately assess the impacts of the incident is by carefully analyzing a complete data set in the proper context.
In the words of Kristin Gardner PhD, Executive Director of the Gallatin River Task Force:
Water data is inherently highly variable across space (landscapes, stream reaches) and time (flow regimes, seasonal changes in temperature and light). In order to interpret watershed data collected at any one given time and location, it must be put into context by comparing it to historical data (if it exists) and the time and location of the data collection. In addition, additional data should be collected in the future to be able to characterize any changes that may have a lag time to detect.
The short and long term impacts to water quality and aquatic life cannot be determined from a single day in the field. Stay tuned for more results, analysis, and information.