USGS discharge data for the Gallatin River near Gallatin Gateway captures dramatic troughs on 1/15, 1/22, 1/31, and 2/17.
Inquiring minds want to know: What caused the repeated dramatic drops in the discharge of the Gallatin River over the past six weeks?
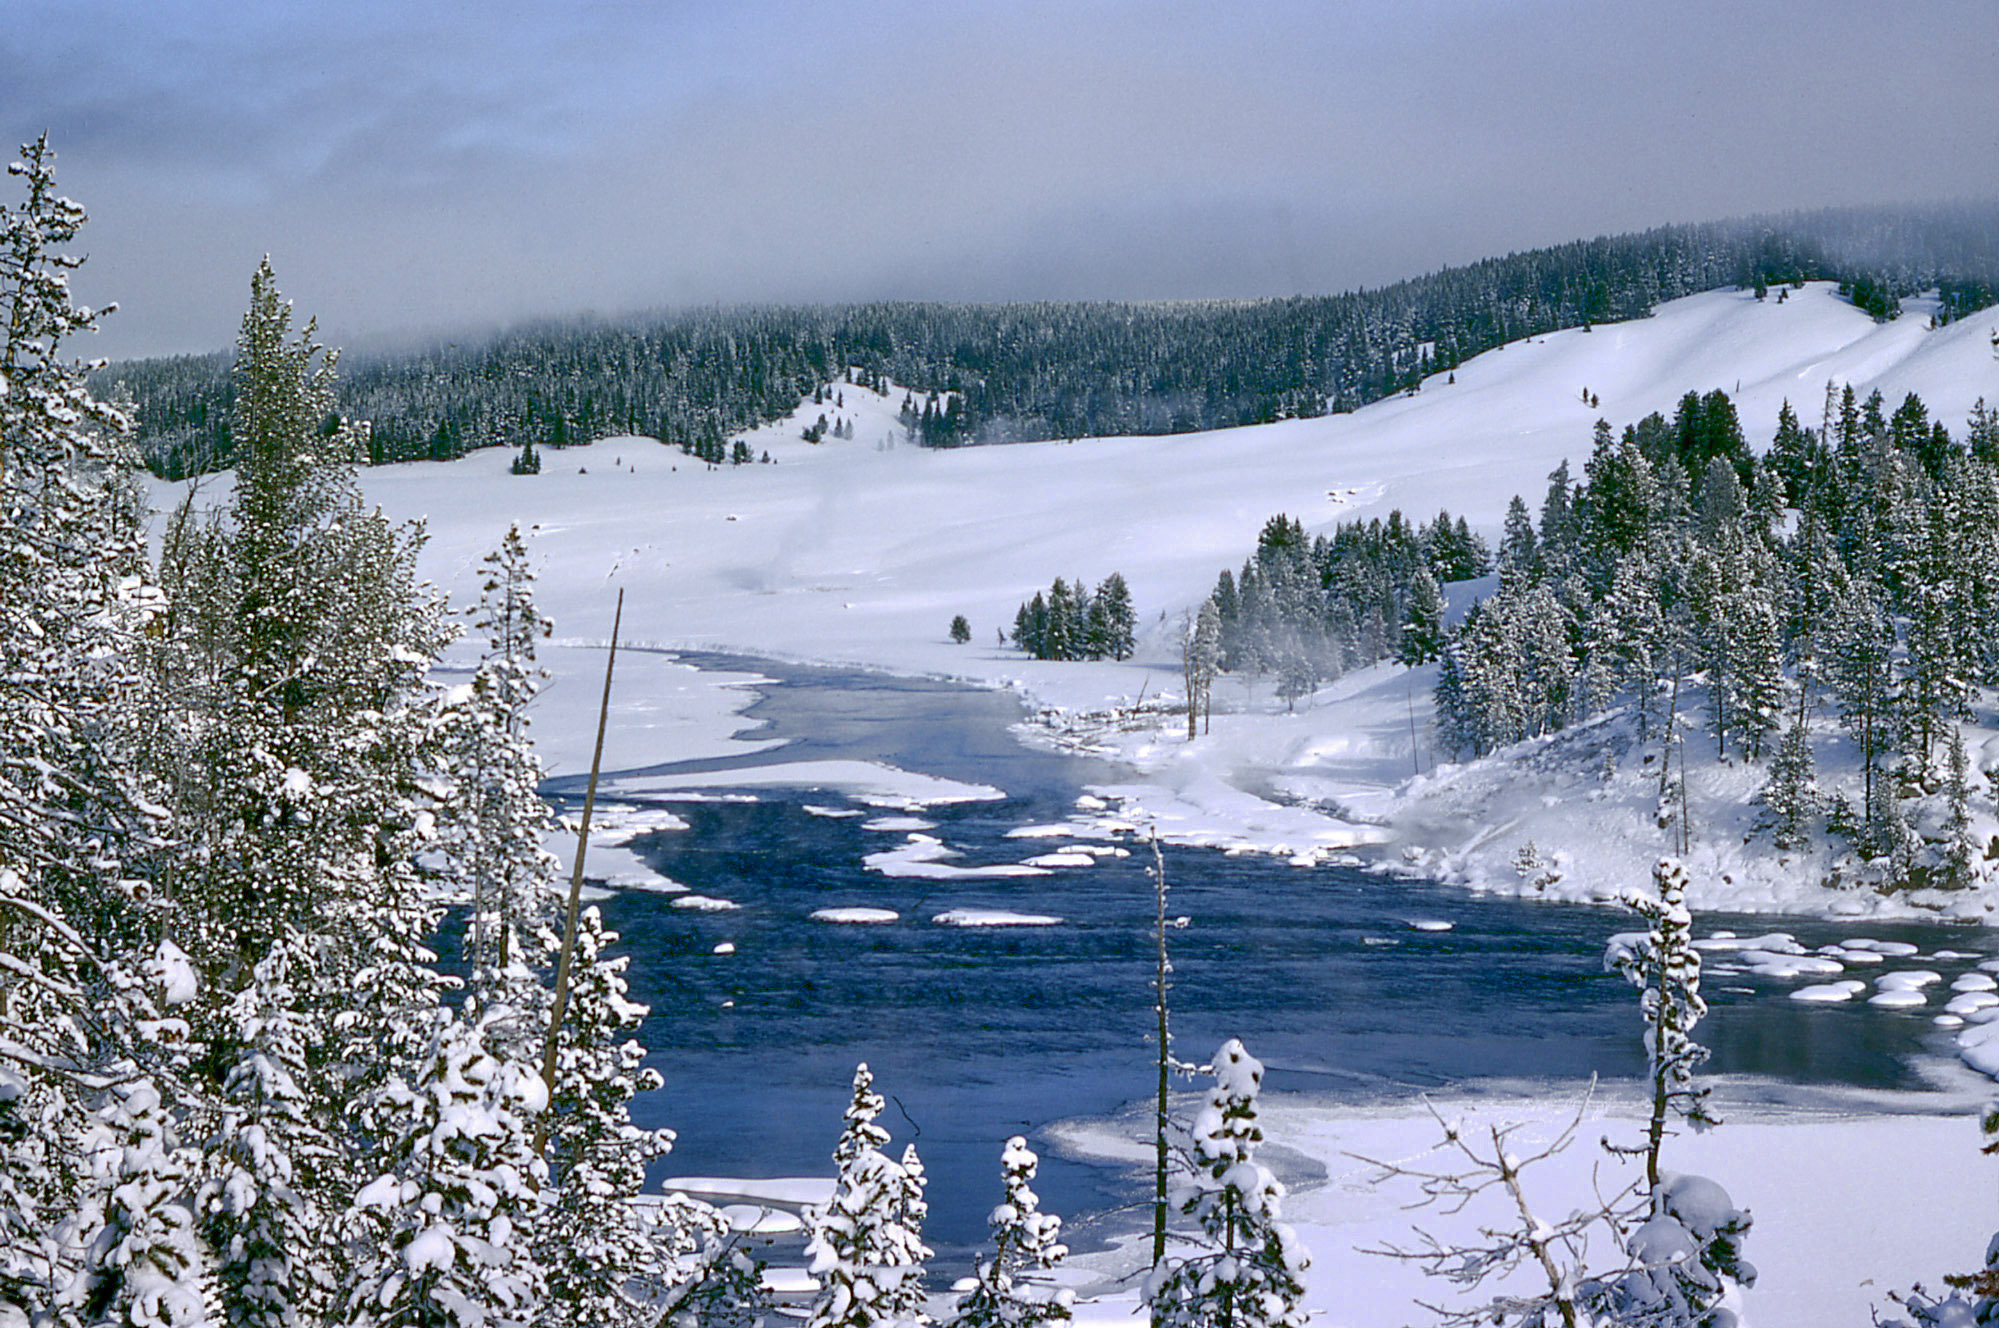
The answer: During the past month and a half, large fluctuations in temperature have effected stream discharge. Recent “unseasonable” temperatures have hovered around freezing. On colder days, ice formation on the Gallatin River trapped water as ice, thereby reducing flow. The dramatic dips in the graph represent cold days where the temperature was low enough for ice to form.
The influence of ice formation on discharge was not insignificant. On January 22, discharge on the Gallatin River dropped by about 100 cubic feet per second. A cubic foot of water weights approximately 62 pound per cubic foot — about the same as the average American 9 year old. Thus, the discharge of the Gallatin was reduced by about 100 speeding third grade students every second. Cool!
Thanks Katie Alvin for inspiring our curiosity and to Norm Midtlyng from the WY-MT Water Science Center for helping us to understand the USGS stream discharge data.
For current conditions, visit the USGS website: http://waterdata.usgs.gov/nwis/uv?site_no=06043500.

